TCGA Pan-Cancer · 32 classes
92.0%
held-out accuracy
87.9% macro-F1 · 49.3 points above the strongest matched node-GNN baseline
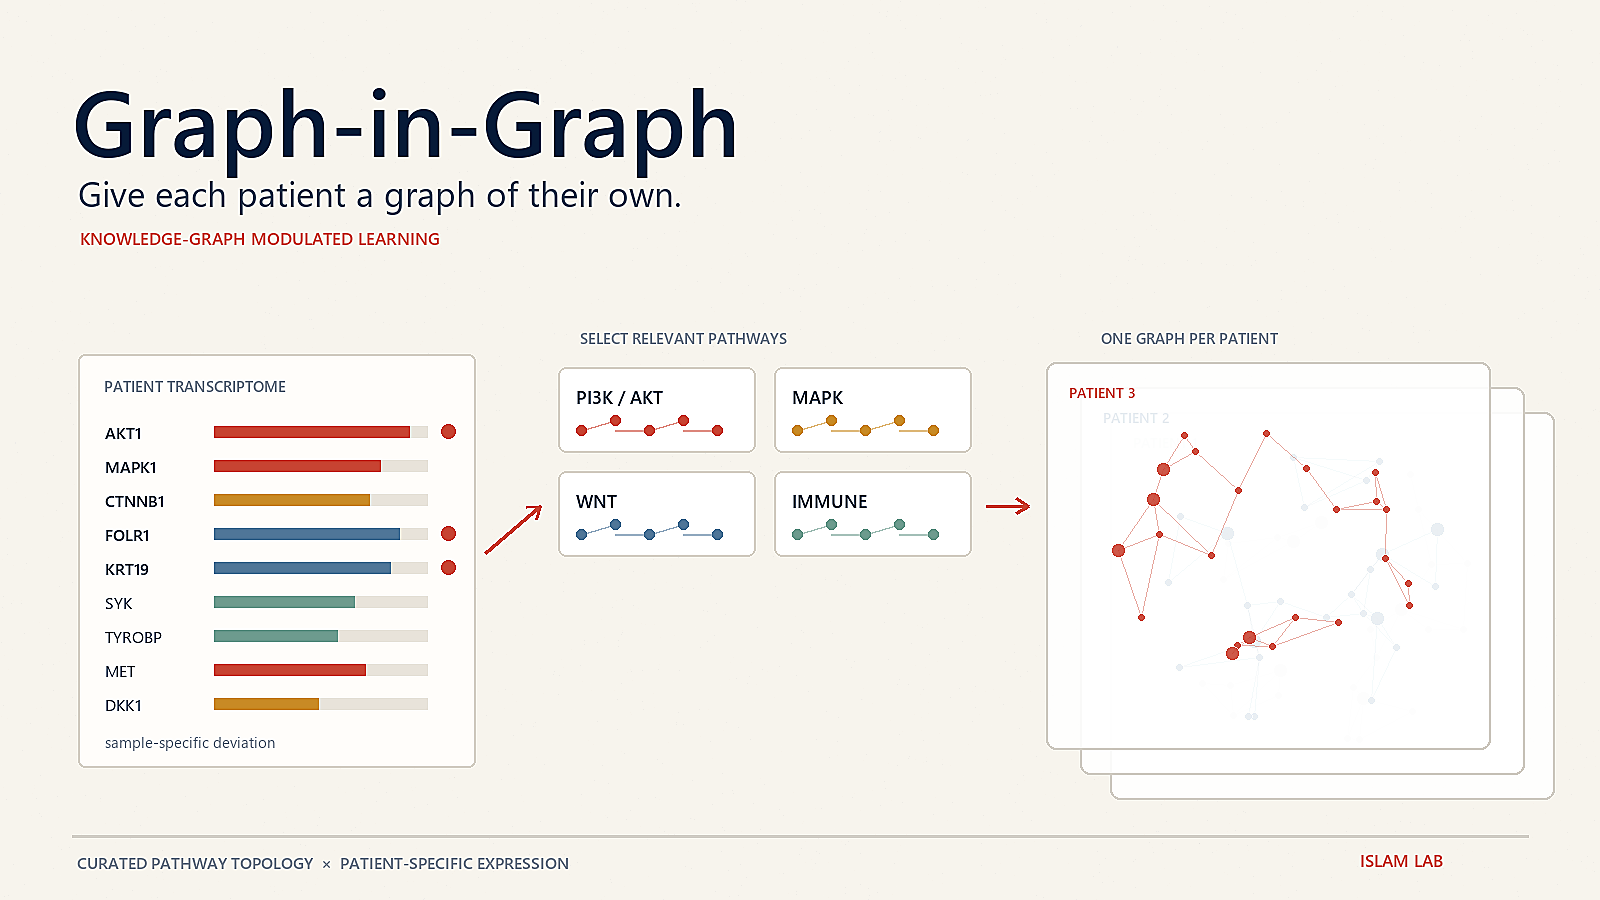
Graph-in-Graph · knowledge-guided clinical AI
GiG turns every transcriptomic profile into its own pathway-structured graph. A graph neural network then learns across a cohort without flattening away the gene–gene organization accumulated in curated biological knowledge.
This research page and its saved results are public. Uploading data opens a separate Google-authenticated workspace.
Evidence, with context
All headline performance values below come from held-out evaluation. Error bars and the exact model backbone remain attached in the interactive evidence explorer.
TCGA Pan-Cancer · 32 classes
92.0%
held-out accuracy
87.9% macro-F1 · 49.3 points above the strongest matched node-GNN baseline
RARE-Seq · plasma cfRNA
87.4%
macro-F1
Cancer versus healthy · approximately 13 points above the strongest matched baseline for the displayed GiG configuration
Study breadth
≈11k
patient expression profiles
Seven cohorts · tissue RNA, plasma cell-free RNA, and tumor-educated platelet RNA
Narrated explainer
The animation follows one profile from dysregulated genes to curated pathways, a patient-specific graph, cohort-level learning, and gene attribution.
Method, in motion
Each sample is a graph. The cohort is a collection of graphs. Learning happens within every patient’s molecular network before a patient-level representation is pooled for prediction.
NodesMeasured genes retained after identifier harmonization and patient-specific pathway assembly.
EdgesUndirected curated interactions recovered from human WikiPathways and filtered to measured genes.
Node channelsWithin-patient expression z-score and cohort-level mean absolute correlation to the top 50 partners.
IdentityA trainable gene embedding anchors the same gene across graphs with different node sets.
Controlled structural test
GiG was retrained after replacing every curated pathway graph with either an edge-count-matched random graph or a degree-preserving rewired graph. Node features and labels stayed fixed.
Low-signal / heterogeneousTopology contributes stronglyRARE-Seq and Pan-Cancer lose 15–32 macro-F1 points after structural randomization.
Highly separable tissue signalNode measurements can dominateProstate performance changes by less than two points under the same controls.
Interactive evidence explorer
Select an analysis and metric. Bars show mean held-out performance; whiskers show the saved fold standard deviation when available.
Biological interpretation
The network below is a de-identified excerpt from one prostate graph. It retains actual pathway edges and overlays cohort-level Integrated Gradients from the saved model.
Saved analyses
Capsule-backed examples open with the existing predictions and metrics already loaded. Supplementary examples open their saved aggregate result.
Loading saved analyses…
Paper
Graph-in-Graph integrates curated biological pathways directly into patient-level predictive modeling. Each transcriptomic profile becomes a standalone molecular graph whose nodes carry patient expression and whose edges preserve pathway interactions. The same graph-level learner can then operate across patients while retaining gene identity and molecular organization. Evaluation spans tissue and liquid-biopsy cohorts, from binary cancer detection to 32-class tumor classification, with controlled topology randomization used to separate the contribution of expression from the contribution of biological structure.
The results support a specific conclusion: pathway topology is most useful when the disease signal is weak, distributed, or heterogeneous. Model attribution can return predictions to genes and their local graph neighborhoods, providing hypotheses for subsequent biological study rather than causal or clinical claims.
Reproducibility
The prepared Code Ocean run loads saved patient graphs and model weights, recomputes held-out predictions, validates them against frozen references, and regenerates main Figures 2–6. It does not silently train a model or rebuild a manuscript cohort.
New users follow a separate tutorial: validate expression and labels, construct pathway graphs from the frozen WikiPathways library, then explicitly start five-fold GiG training.
BibTeX
@article{xue2026graphingraph,
  title   = {Knowledge Graph Modulated Deep Learning for Limited-Sample Clinical Data Analysis},
  author  = {Xue, Yuwei and Mostafa, Sakib and Zou, James and Liao, Joseph and Diehn, Maximilian and Alizadeh, Ash A. and Xing, Lei and Islam, Md. Tauhidul},
  year    = {2026},
  journal = {arXiv preprint arXiv:2605.24162},
  doi     = {10.48550/arXiv.2605.24162},
  url     = {https://arxiv.org/abs/2605.24162}
}
Analyze your data
The authenticated workspace accepts a samples-by-genes expression CSV, a separate labels CSV, and—when needed—an explicit gene-to-HGNC mapping file. Validate and preview graphs before committing to a queued five-fold training job.
Open the analysis workspace01Expressionsample_id, TP53, KRAS, …
02Labelssample_id, label
03Optional mappinginput_gene, hgnc_symbol
04MinimumFive samples in every class
Use responsibly
Cross-validation estimates performance within the submitted cohort. It does not establish transportability to another assay, institution, population, or clinical workflow.
Model attributions describe the fitted model and do not establish causality or validate a biomarker. Do not upload protected health information or direct identifiers.