Dynomap: Learn the structure hidden in biomedical tables. Tabular features flow into a learned spatial map.
Dynamic feature mapping · Biomedical tabular learning

Vision-Based Deep Learning of Biomedical Tabular Data via Self-Supervised Cartographic Representation

0.835–0.982pooled out-of-fold AUROC across ten donor-disjoint liquid-biopsy tasks
93%cancer-versus-control accuracy in the RARE-Seq cfRNA cohort
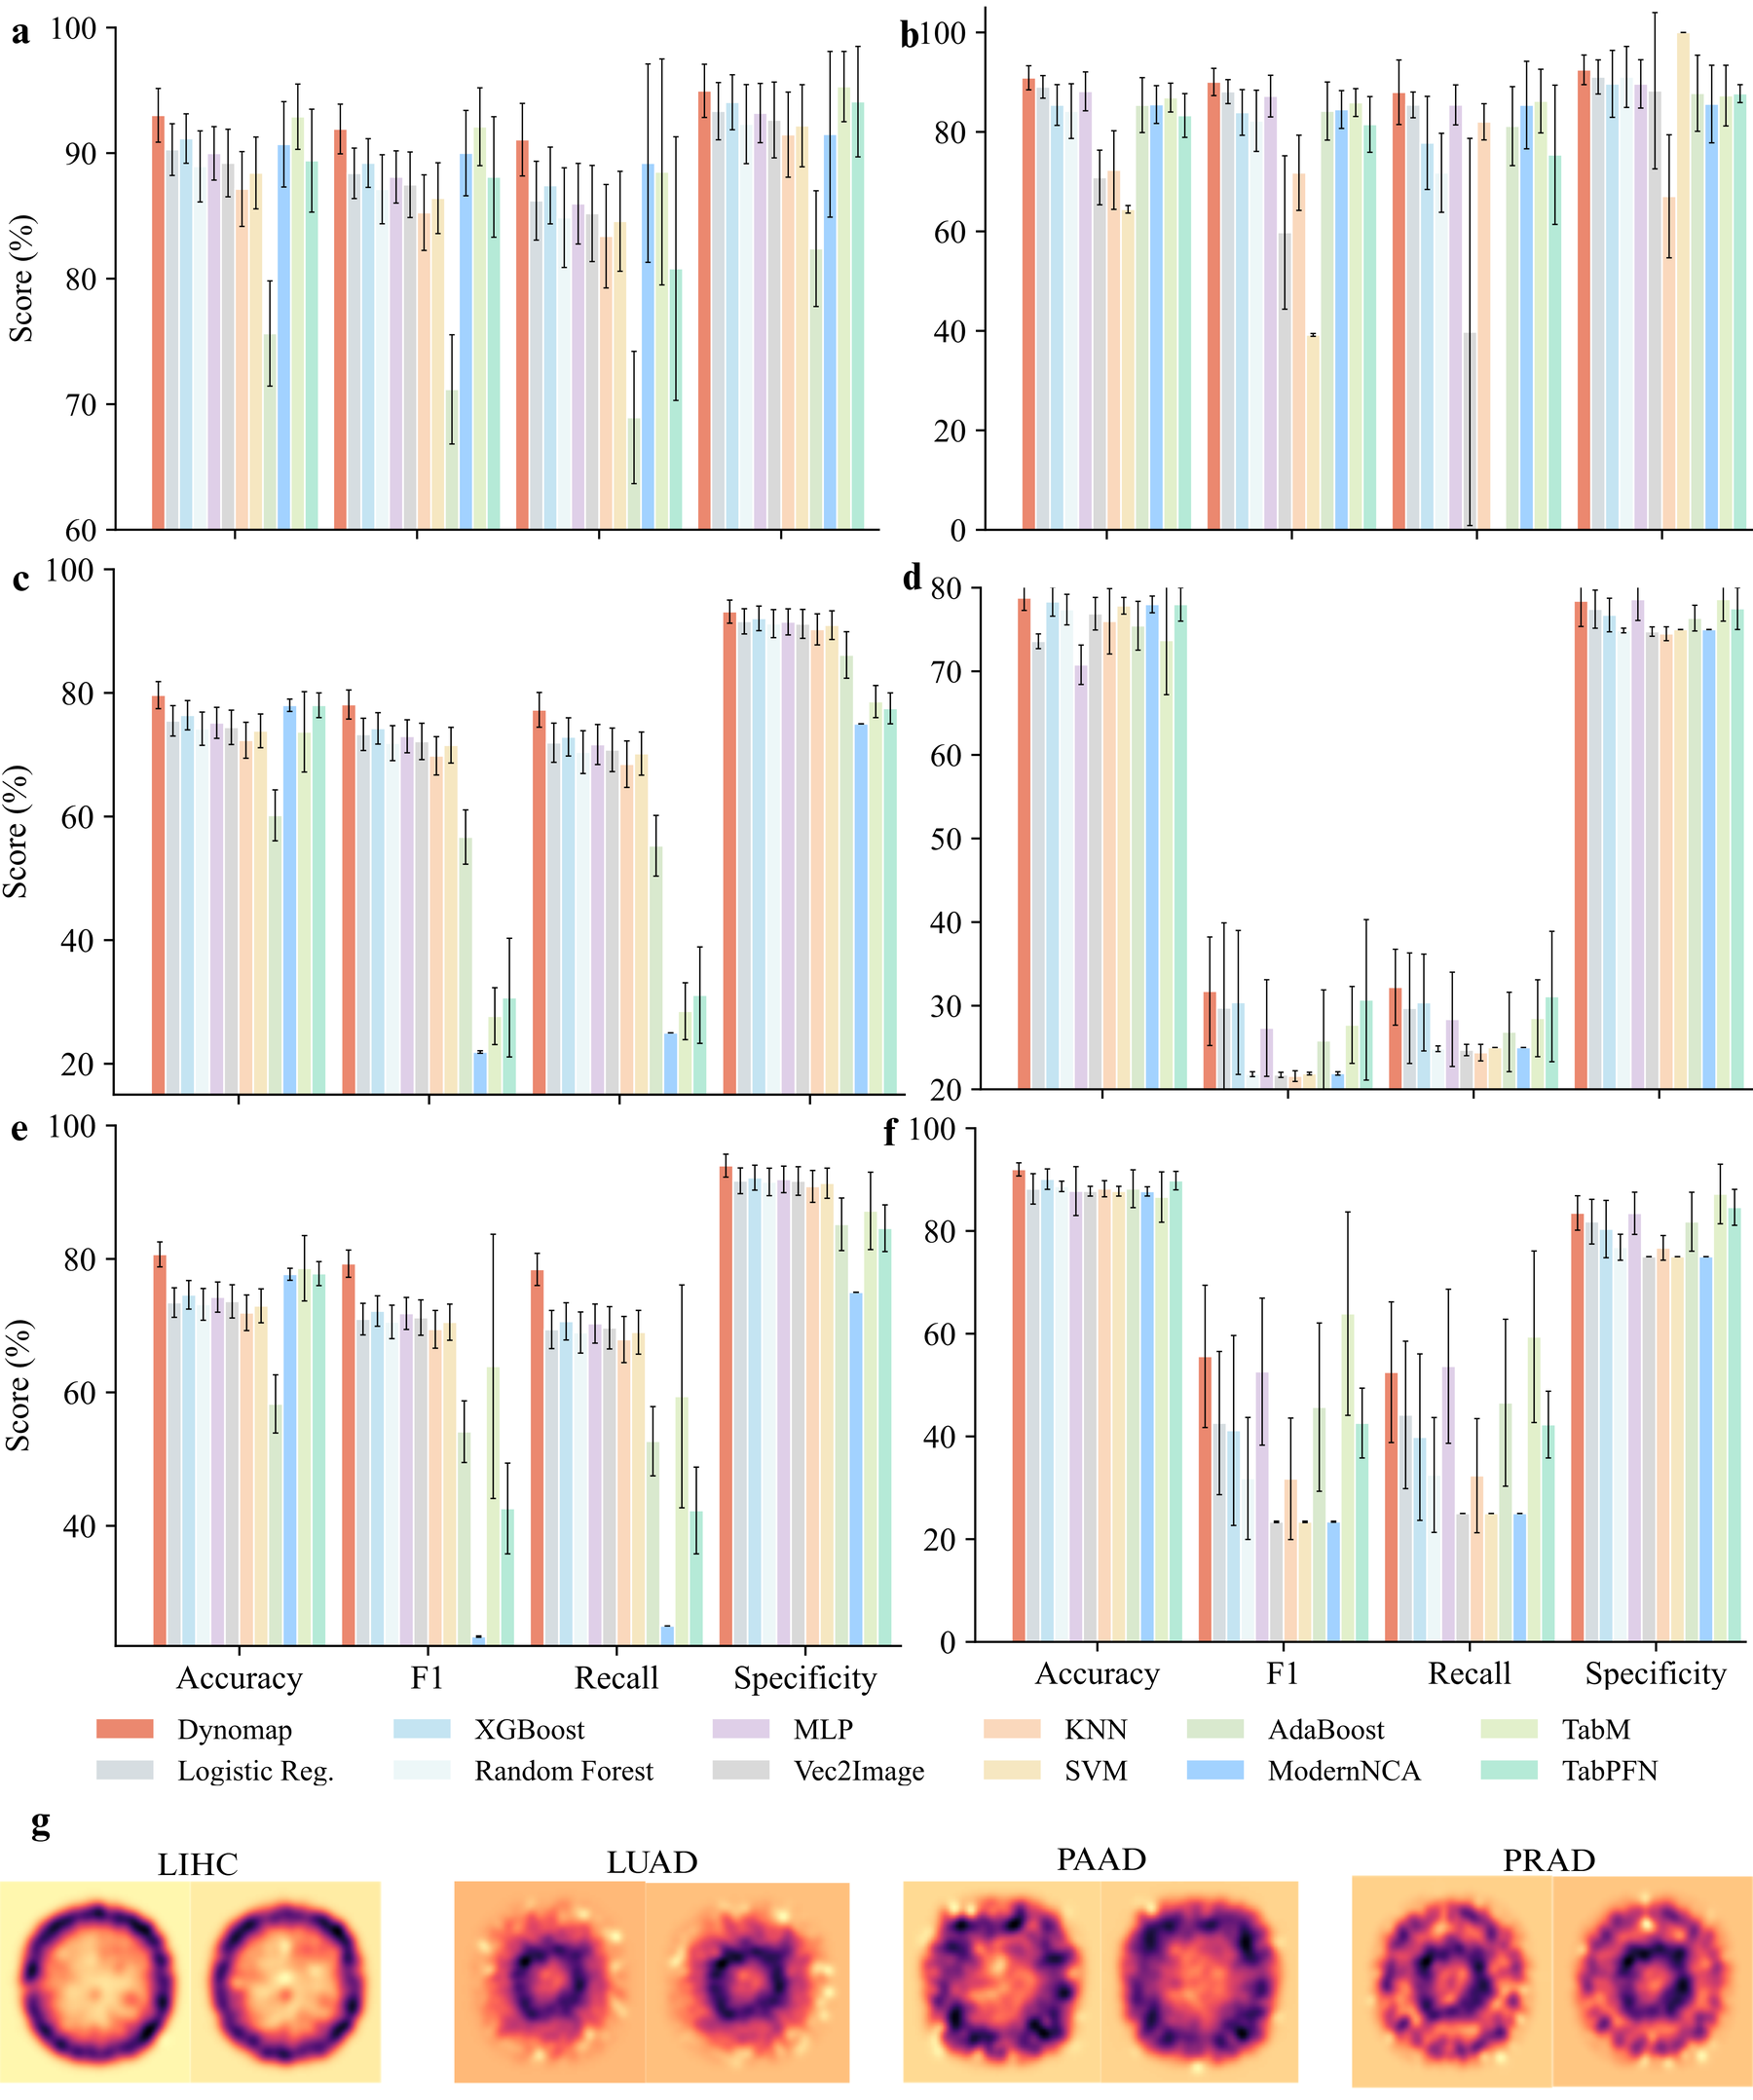
92%five-class cancer-subtype accuracy using the curated 622-gene panel
Watch · narrated explainer

See Dynomap learn.

An explanation of the complete pipeline: feature gating, coordinate learning, differentiable rendering, local pattern recognition, prediction, and attribution.

Video 1 | How Dynomap learns a map. A narrated, captioned animation follows one biomedical table through the trainable feature gate, moving coordinates, Gaussian rendering, vision branch, prediction head, and attribution output. Reported numbers are taken from the current manuscript.
The method

Watch the representation change during training.

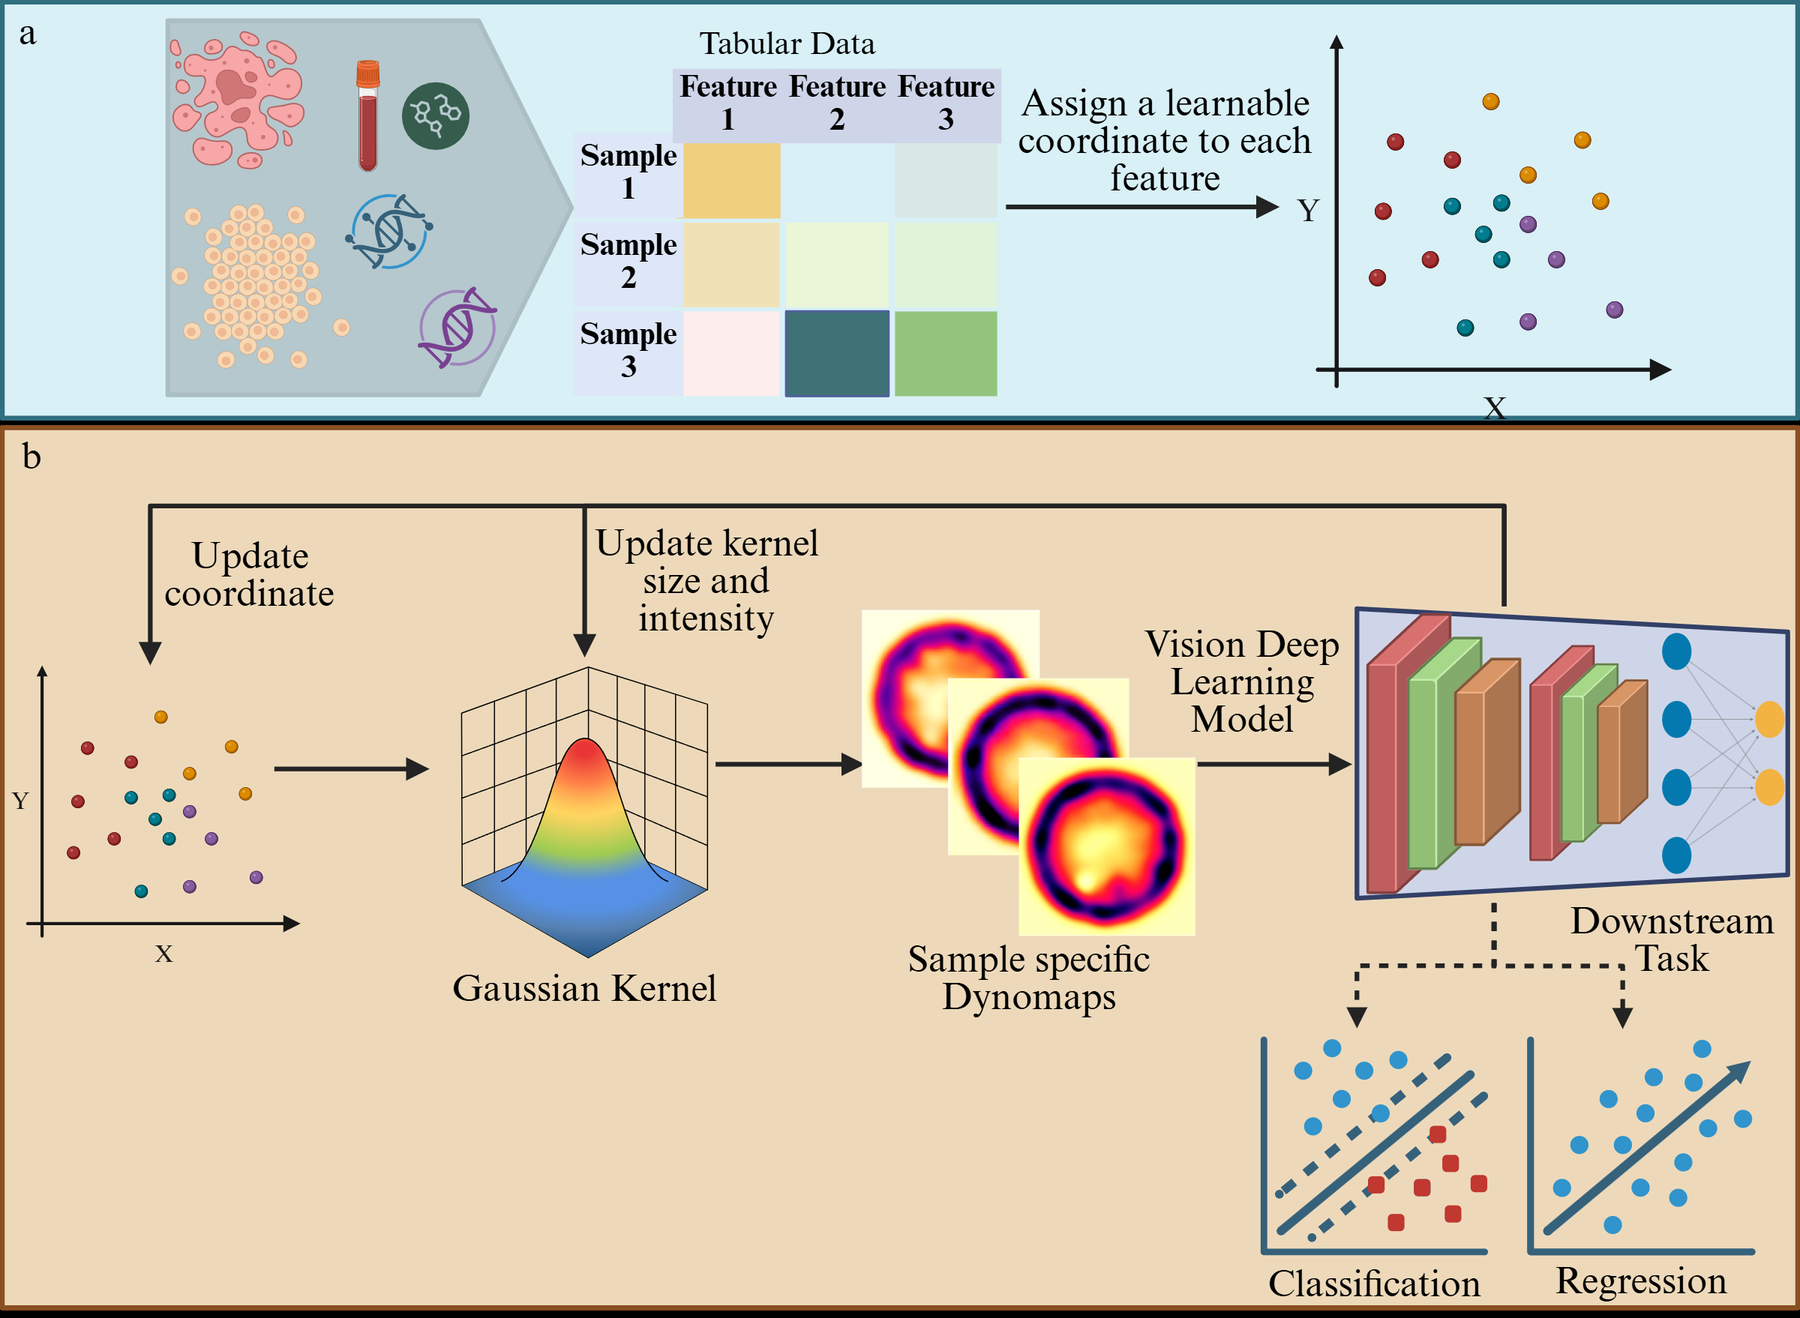
The values in a row do not move. What changes is where each feature is rendered, allowing a vision model to learn local interactions that a plain unordered vector does not expose.

1. Unordered table
  1. Gateamplify useful measurements
  2. Placelearn continuous coordinates
  3. Renderpaint a sample-specific map
  4. Readdetect local predictive structure
Compare the animation with manuscript Figure 1
Figure 1 of the current Dynomap manuscript, showing learnable feature coordinates, Gaussian rendering, sample-specific maps, and downstream prediction.
Figure 1 | Overview of the Dynomap framework. The original publication figure is retained here as the technical reference, rather than presented as another gallery item.

Loading 59 saved analyses…

Cross-cohort evidence

Retrained successfully across RNA carriers and cohorts.

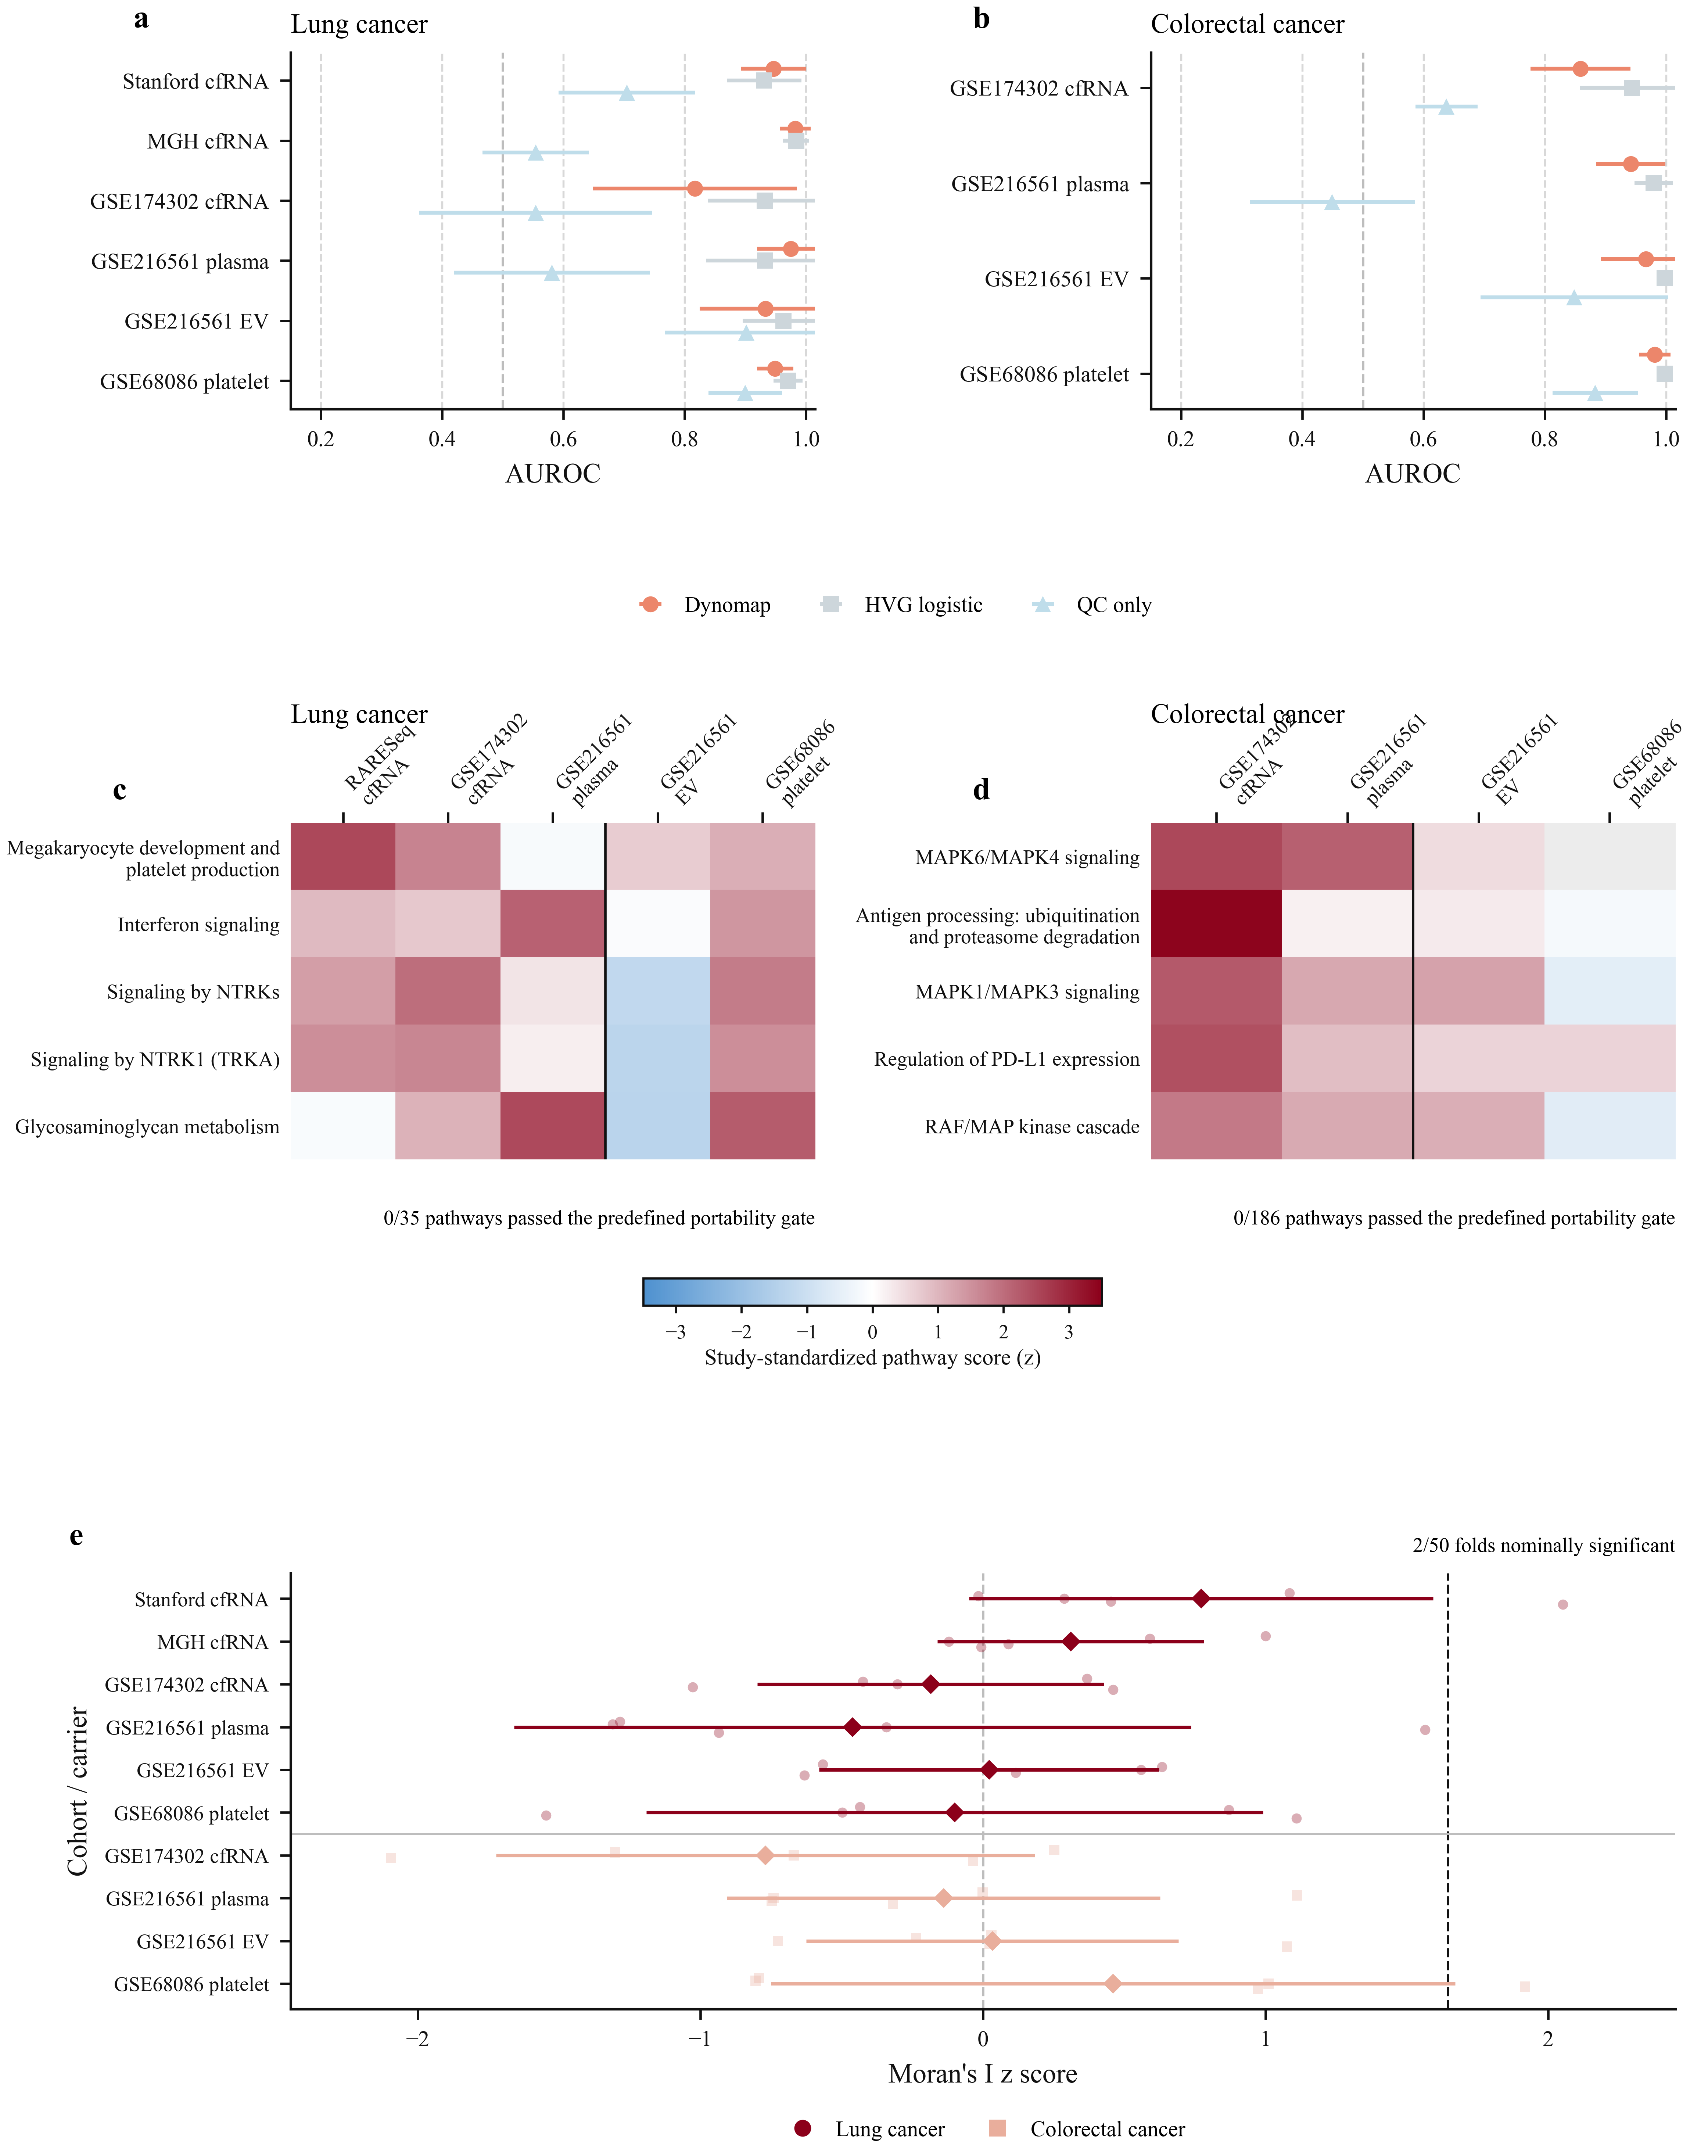
We independently retrained Dynomap for ten donor-disjoint cancer-versus-control tasks spanning plasma cell-free RNA, extracellular-vesicle RNA, and tumor-educated platelet RNA.

Pooled out-of-fold AUROCs ranged from 0.835 to 0.982. Each cohort, carrier, disease contrast, feature-selection step, and cross-validation fold was evaluated independently.

Plasma cfRNAEV RNAPlatelet RNALung cancerColorectal cancer
AUROC across lung- and colorectal-cancer liquid-biopsy cohorts for Dynomap, logistic regression, and a quality-control-only model.
Mean fold AUROC and standard deviation. Orange: Dynomap; gray: matched highly-variable-gene logistic regression; blue: quality-control-only model.
Attribution on the learned map

Important features are visible where Dynomap placed them.

Point size encodes source Integrated Gradients magnitude. Color indicates the direction of the source association. Select a discovery task, then hover or focus a labeled feature.

Numbers inside the evidence

Three results, each tied to what the map revealed.

The original figures remain available, but each is now framed by the result it supports rather than displayed as an undirected gallery.

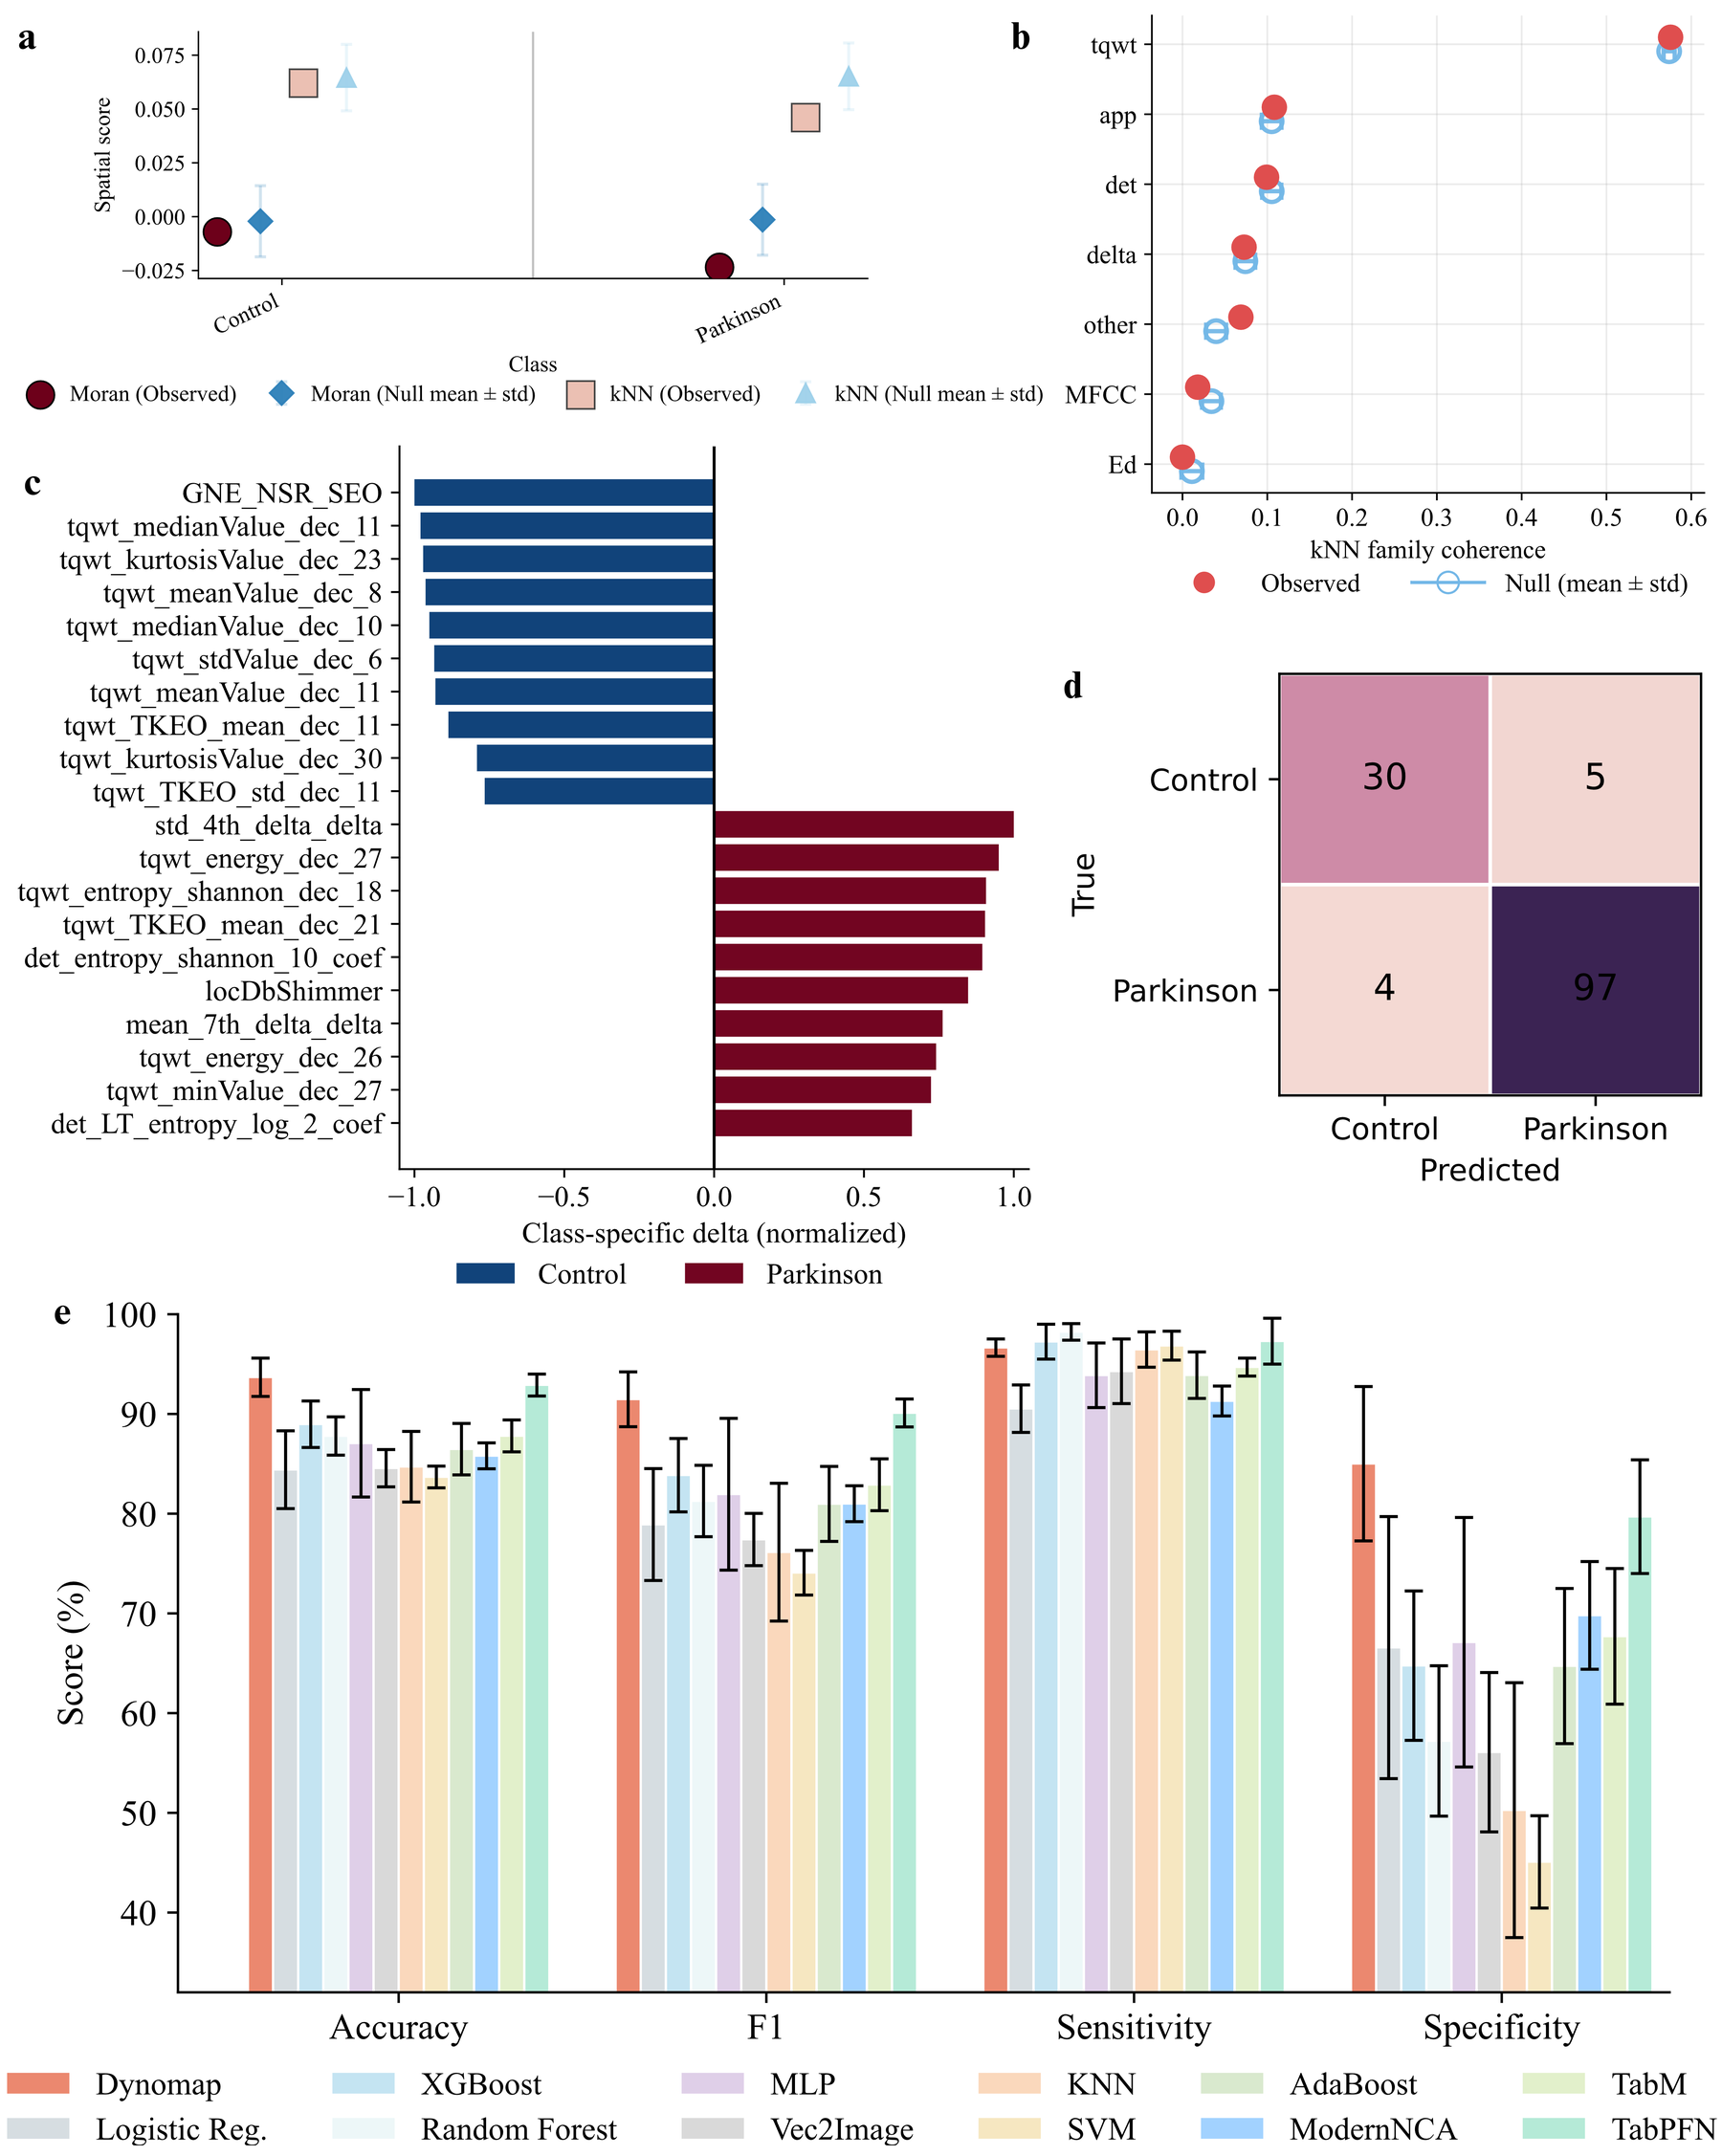
93.7%accuracyParkinson versus control
Parkinson voice feature attribution and spatial structure from manuscript Figure 6.Figure 6 · inspect full result

Voice features self-organized without a biological pathway prior.

TQWT spectral-energy and entropy descriptors formed localized attribution neighborhoods, while Dynomap reached 91.5% macro-F1 and 96.7% macro-sensitivity.

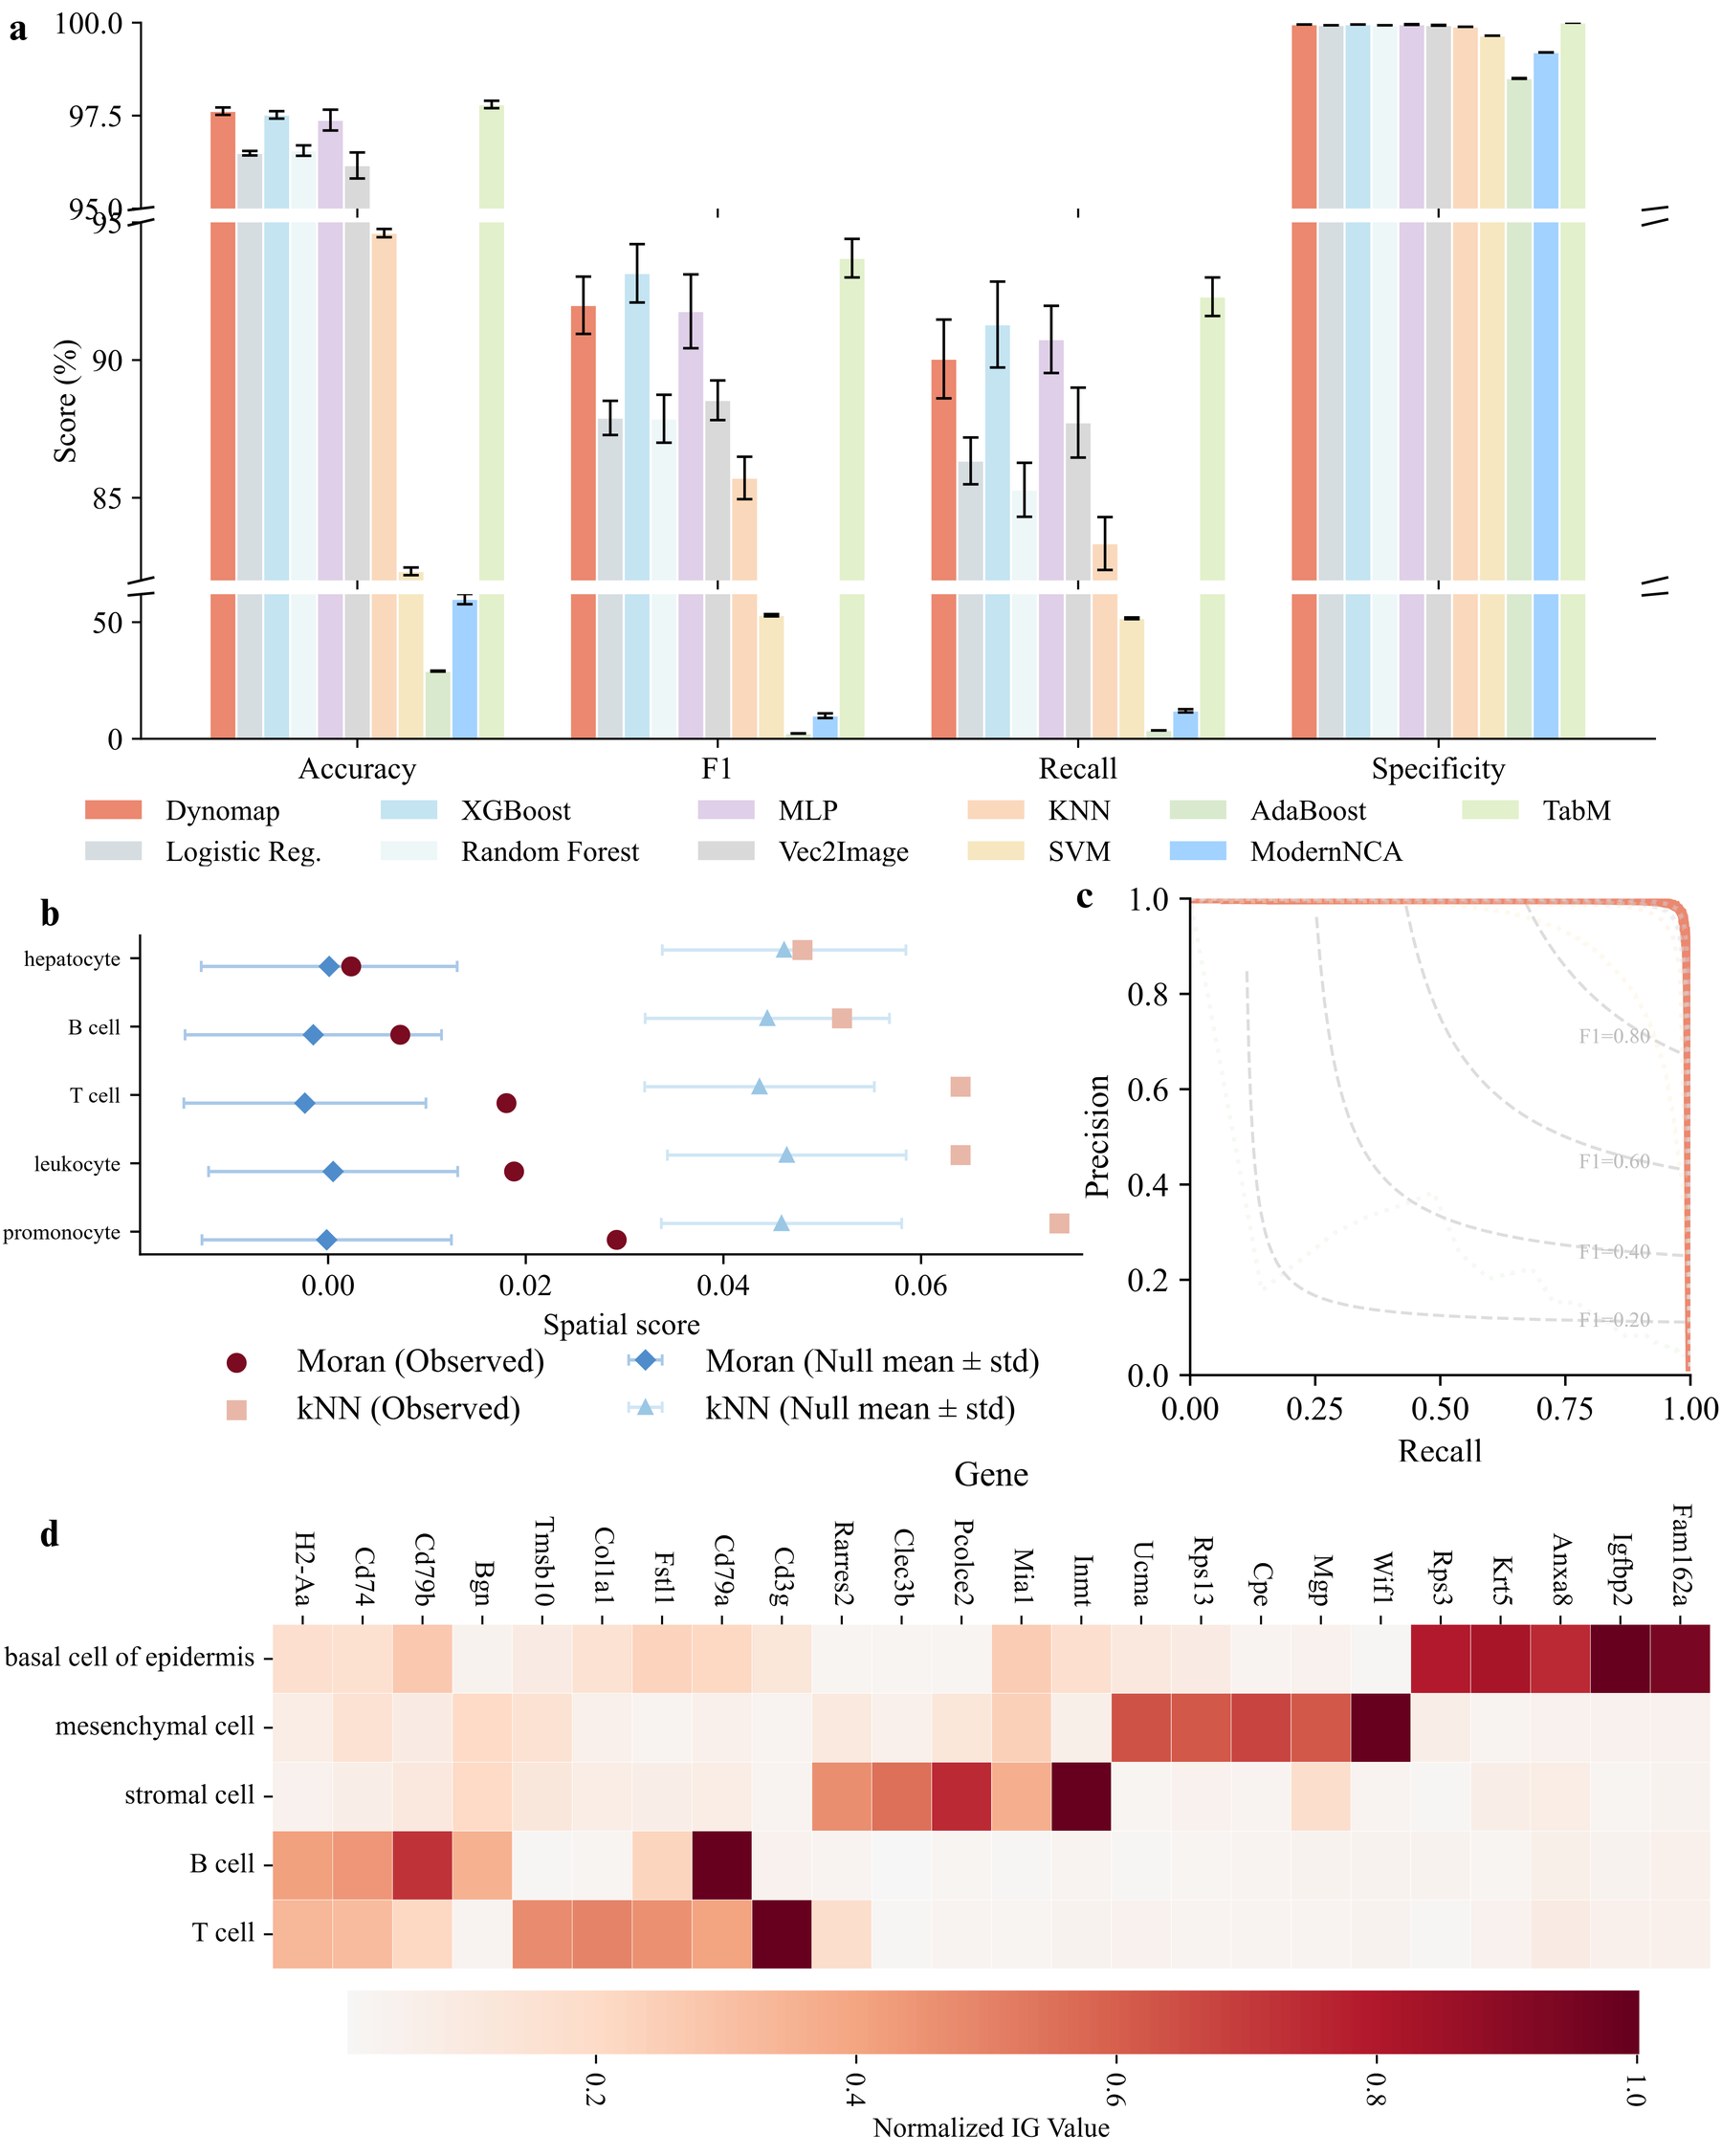
97.6%accuracy55 Tabula Muris cell types
Single-cell lineage attribution and spatial structure from manuscript Figure 8.Figure 8 · inspect full result

The layout recovered lineage-aligned attribution neighborhoods.

T-cell signal emphasized Cd3g; B-cell populations highlighted Cd79b and Cd74; stromal populations emphasized Col1a1 and Col3a1.

0.835–0.982pooled AUROC10 donor-disjoint tasks
Liquid-biopsy evaluation and learned maps from manuscript Figure 2.Figure 2 · inspect full result

The framework retrained across three circulating-RNA carriers.

Plasma cfRNA, extracellular-vesicle RNA, and platelet RNA tasks were evaluated independently by cohort and carrier.

Abstract · current manuscript

Vision-based learning for non-spatial biomedical inputs.

Tabular data constitute a dominant representation in biomedical science. Unlike images, texts, or time series, tabular representation of a dataset generally lacks structural organization: features are treated as unordered dimensions, and their interrelationships must be inferred implicitly by learning algorithms. This fundamental structural limitation constrains the ability of convolutional neural networks, vision transformers, and other structure-aware vision architectures to exploit local correlations and higher-order interactions that encode underlying biological and clinical signals. Here we introduce Dynamic Feature Mapping (Dynomap), an end-to-end deep learning cartography framework that learns a task-optimized spatial topology of features directly from data. Dynomap discovers inter-feature dependencies and jointly optimizes their spatial arrangement with a predictive objective through a differentiable rendering mechanism, without reliance on heuristics, predefined feature groupings, or external priors.

By transforming high-dimensional tabular vectors into learned feature maps, Dynomap enables vision-based deep learning architectures to operate effectively on non-spatial biomedical inputs and achieves substantially better predictive performance compared to existing state-of-the-art methods across clinical and biological datasets. When applied to a lung cancer liquid biopsy dataset from Stanford Hospital, Dynomap organizes genes from a curated cancer-associated panel into coherent spatial structures and improves multiclass cancer subtype prediction accuracy by up to 18% relative to classical and state-of-the-art deep learning tabular analysis methods. In a Parkinson’s disease voice dataset, Dynomap spatially clusters disease-associated acoustic descriptors, including tunable Q-factor wavelet energy and entropy measures linked to vocal instability, and yields accuracy gains of up to 8% compared to state-of-the-art techniques. Similar performance improvements were observed when Dynomap was applied to 13 additional public tabular benchmarks spanning molecular and non-biomedical domains. By converting unordered feature spaces into learned spatial representations, Dynomap establishes a general and principled strategy for bridging tabular and vision-based deep learning and enables the discovery of structured, task-relevant patterns from unordered high-dimensional biomedical data.
BibTeX

Cite the current manuscript.

@article{mostafa2026dynomap,
  title   = {Vision-Based Deep Learning of Biomedical Tabular Data via Self-Supervised Cartographic Representation},
  author  = {Mostafa, Sakib and Jiang, Yuming and Zou, James and Massoud, Tarik F. and Alizadeh, Ash A. and Diehn, Maximilian and Xing, Lei and Islam, Md Tauhidul},
  year    = {2026},
  note    = {Manuscript; earlier version available as arXiv:2603.22675},
  url     = {https://arxiv.org/abs/2603.22675}
}
Authors · current PDF
Sakib MostafaStanford Radiation OncologyWebsiteLinkedInGoogle ScholarYuming JiangWake Forest Radiation OncologyJames ZouStanford Biomedical Data ScienceTarik F. MassoudStanford RadiologyAsh A. AlizadehStanford MedicineMaximilian DiehnStanford Radiation OncologyLei Xing *Corresponding authorMd Tauhidul Islam *Corresponding author · Islam Lab
Analyze your data

Bring a labelled table. Receive an auditable model report.

The private beta accepts one labelled CSV or separate feature and label CSV files. Rows must correspond in the same order. Choose the outcome column and, if applicable, a donor or subject column.

Open the analysis workspace →
Use responsibly

A research analysis—not a clinical test.

Cross-validation estimates performance within the uploaded dataset. It does not establish transportability to another institution, assay, population, or clinical setting.

Feature attribution describes the fitted model and does not establish biological causality. Do not upload protected health information or direct identifiers.